
Have you ever wondered why your mortgage rate or savings account interest rate changes so frequently? The answer lies in the complex and fascinating history of U.S. interest rate trends. From the placid post-war economy of the 1950s to the volatile periods of the 1980s and the unprecedented policies of the 21st century, understanding these trends is crucial for anyone making financial decisions. This article will provide a comprehensive look at the historical U.S. interest rate landscape from 1954 to 2025, offering key insights and a clear outlook for the future.
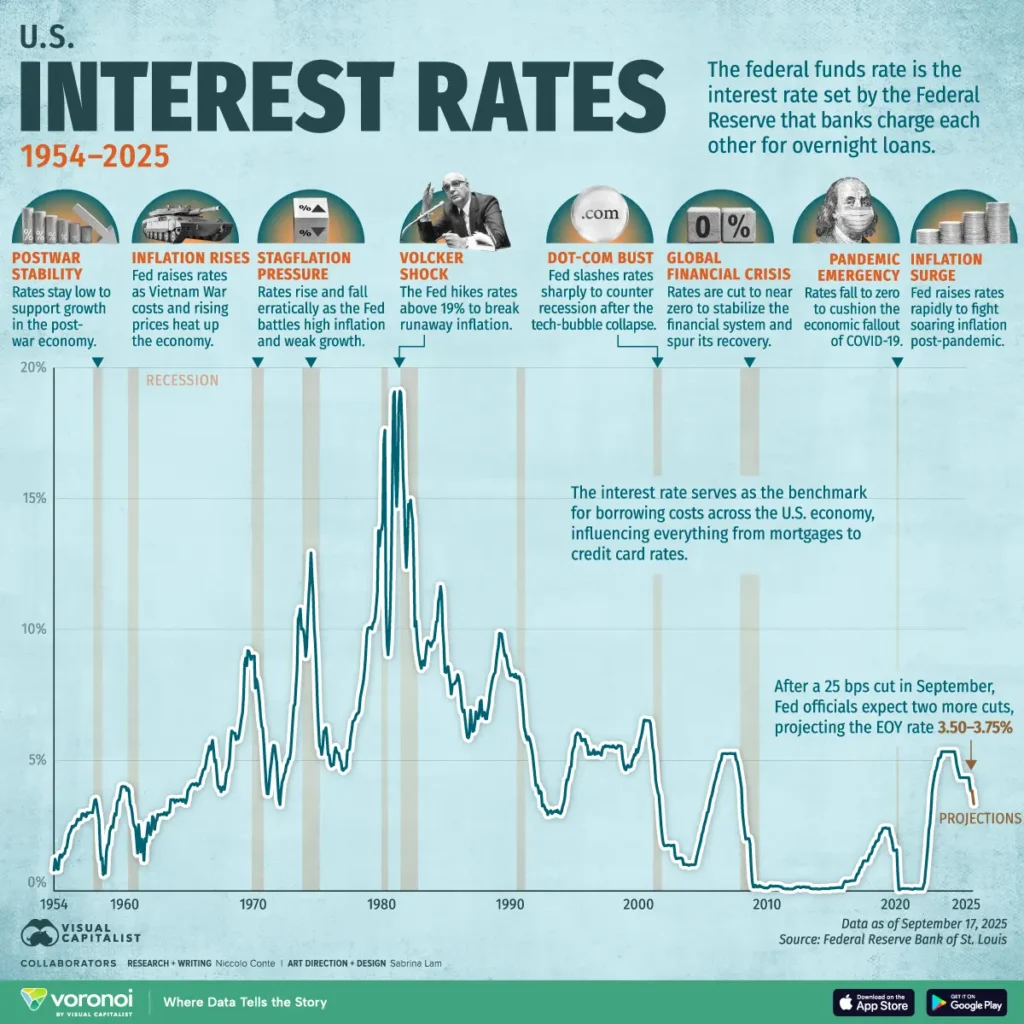
The history of U.S. interest rates isn’t just a dry chart of numbers; it’s a narrative of economic booms, busts, and the Federal Reserve’s tireless effort to balance inflation and employment. For decades, the Federal Reserve (the Fed) has used its monetary policy tools, primarily the federal funds rate, to steer the American economy. A simple query like what were interest rates in 1954? reveals a starkly different financial world than today’s. According to historical data, the average U.S. interest rate in 1954 was just 1.01%, reflecting a period of post-war economic stability and growth. This era saw a boom in homeownership, partly fueled by accessible financing and stable rates.
The problem, however, is that this stability didn’t last. The late 1970s and early 1980s saw the most dramatic period in modern interest rate history. Fueled by high inflation, the Fed, under Chairman Paul Volcker, took aggressive action. The provided data shows the U.S. average interest rate soaring to a record high of 16.38% in 1981, a pivotal moment in the historical interest rate in the US. This painful but necessary shock was designed to wring inflation out of the system, a move that had a profound effect on everything from home loans to business investment.
For the modern consumer or business owner, these historical highs and lows aren’t just historical footnotes. They demonstrate the immense power of the Fed’s decisions and their impact on your personal finances.
Today’s economic landscape is once again defined by interest rate speculation. The central question for many is: Are interest rates going down in 2025 in the USA? After a series of rapid rate hikes in 2022-2023 to combat soaring inflation, the Fed’s stance has shifted. The most recent data from the Federal Reserve indicates a cautious pivot. As of September 2025, the Fed has made its first rate cut of the year, signaling a potential new cycle of monetary easing.
According to a September 2025 report from the U.S. Federal Reserve, the federal funds rate was cut to a range of 4.00%-4.25%. The provided data forecasts a U.S. average interest rate of 4.21% for 2025, a decrease from the 5.14% average in 2024. This forecast provides significant hope for homebuyers, business owners, and consumers who have been grappling with high borrowing costs.
What Would Happen If a President Cut Interest Rates? The Trump Factor
The Fed operates as an independent body, but its policy decisions are often scrutinized by politicians. The question, “What would happen if Trump cut interest rates?” highlights this political-economic dynamic. While a president cannot directly cut rates, they can pressure the Fed and appoint new governors who share their economic philosophy. A rapid, politically motivated cut could lower borrowing costs and stimulate economic activity in the short term, potentially boosting the stock market and corporate investment. However, it could also risk reigniting inflationary pressures if not aligned with underlying economic conditions. History shows that sustained economic stability is best achieved when monetary policy is insulated from short-term political demands.
Understanding the U.S. Interest Rate Trends (1954-2025) Chart
A visual representation, such as a U.S. interest rates chart covering the past 70 years, is essential for truly grasping the cyclical nature of monetary policy. Here is a table of the data that serves as a U.S. interest rate trends 1954 to 2025 chart:
U.S. Average Interest Rates (1954-2025)
| Year | U.S. Average Interest Rate | Year | U.S. Average Interest Rate | Year | U.S. Average Interest Rate |
| 1954 | 1.01% | 1975 | 5.82% | 1996 | 5.30% |
| 1955 | 1.79% | 1976 | 5.05% | 1997 | 5.46% |
| 1956 | 2.73% | 1977 | 5.54% | 1998 | 5.35% |
| 1957 | 3.11% | 1978 | 7.93% | 1999 | 4.97% |
| 1958 | 1.57% | 1979 | 11.19% | 2000 | 6.24% |
| 1959 | 3.31% | 1980 | 13.36% | 2001 | 3.89% |
| 1960 | 3.22% | 1981 | 16.38% | 2002 | 1.67% |
| 1961 | 1.96% | 1982 | 12.26% | 2003 | 1.13% |
| 1962 | 2.71% | 1983 | 9.09% | 2004 | 1.35% |
| 1963 | 3.18% | 1984 | 10.23% | 2005 | 3.21% |
| 1964 | 3.50% | 1985 | 8.10% | 2006 | 4.96% |
| 1965 | 4.08% | 1986 | 6.81% | 2007 | 5.02% |
| 1966 | 5.11% | 1987 | 6.66% | 2008 | 1.93% |
| 1967 | 4.22% | 1988 | 7.57% | 2009 | 0.16% |
| 1968 | 5.66% | 1989 | 9.22% | 2010 | 0.18% |
| 1969 | 8.20% | 1990 | 8.10% | 2011 | 0.10% |
| 1970 | 7.18% | 1991 | 5.69% | 2012 | 0.14% |
| 1971 | 4.66% | 1992 | 3.52% | 2013 | 0.11% |
| 1972 | 4.43% | 1993 | 3.02% | 2014 | 0.09% |
| 1973 | 8.73% | 1994 | 4.20% | 2015 | 0.13% |
| 1974 | 10.50% | 1995 | 5.84% | 2016 | 0.40% |
| 2017 | 1.00% | ||||
| 2018 | 1.83% | ||||
| 2019 | 2.16% | ||||
| 2020 | 0.38% | ||||
| 2021 | 0.08% | ||||
| 2022 | 1.68% | ||||
| 2023 | 5.02% | ||||
| 2024 | 5.14% | ||||
| 2025 | 4.21% |
Export to Sheets
Looking at a U.S. interest rate history 100 years chart reveals a few key patterns:
- 1950s-1960s: A period of low, stable rates, with the average fluctuating between 1% and 5.11%. This was a golden age for financing new homes.
- 1970s-Early 1980s: An era of extreme volatility and a steep upward climb, culminating in the highest interest rate in US history at 16.38% in 1981.
- 1980s-1990s: A gradual and sometimes bumpy return to more moderate rates.
- 2000s-2010s: The “Great Recession” led to a sustained period of near-zero rates to stimulate the economy.
- 2020s: A swift return to higher rates to fight inflation, followed by the beginning of a new easing cycle.
For example, a historical interest rates chart for mortgages shows the stark difference between the 1981 peak of over 16% and the all-time lows of under 3% in 2021. Understanding these cycles helps contextualize today’s rates and provides a framework for future financial planning.
Navigating the current economic climate requires a clear strategy. While the Fed’s actions are steering the economy toward a new rate environment, individual financial decisions remain paramount. Here are some actionable takeaways:
- For Homeowners: The recent rate cuts are a sign of potential relief. If you have a high-interest mortgage from the 2022-2024 period, monitor the U.S. interest rate trends 1954 to 2025 mortgage chart. You may be in a prime position to refinance in late 2025 or early 2026.
- For Consumers: Lower rates can mean better deals on auto loans and credit cards. Use this opportunity to consolidate debt or secure financing for a major purchase.
- For Savers and Investors: As rates come down, the returns on high-yield savings accounts and CDs may decrease. Consider consulting a financial advisor to re-evaluate your investment strategy and seek out new opportunities.
A recent report from the U.S. Federal Reserve (September 17, 2025) confirms the cautious but definitive shift in policy. The Fed stated its “strong commitment to supporting maximum employment and returning inflation to its 2 percent objective,” a signal that the focus is now on balancing economic growth with price stability.
People Also Asked
Q: When was the highest interest rate in US history? A: The highest interest rate in U.S. history occurred in the early 1980s. The federal funds rate peaked at 20% in June 1981, as the Federal Reserve, led by Chairman Paul Volcker, aggressively tightened monetary policy to combat rampant inflation.
Q: What is the historical interest rate in the US? A: The historical interest rate in the US refers to the long-term averages and fluctuations of the federal funds rate and other lending rates. Based on the provided data, the average U.S. interest rate has varied dramatically, from a low of 0.08% in 2021 to a high of 16.38% in 1981.
Q: What were interest rates in the 1950s? A: In the 1950s, interest rates were significantly lower and more stable than in later decades. The provided data shows average annual rates ranging from 1.01% in 1954 to 3.31% in 1959, reflecting a period of post-war economic expansion and government support for homeownership.
Q: Are interest rates going down in 2025 in the USA? A: Yes, based on the Federal Reserve’s most recent actions and projections, interest rates are expected to continue going down in the USA in 2025. The provided data forecasts the average U.S. interest rate to be 4.21% for the year, a clear decline from 2024.


