

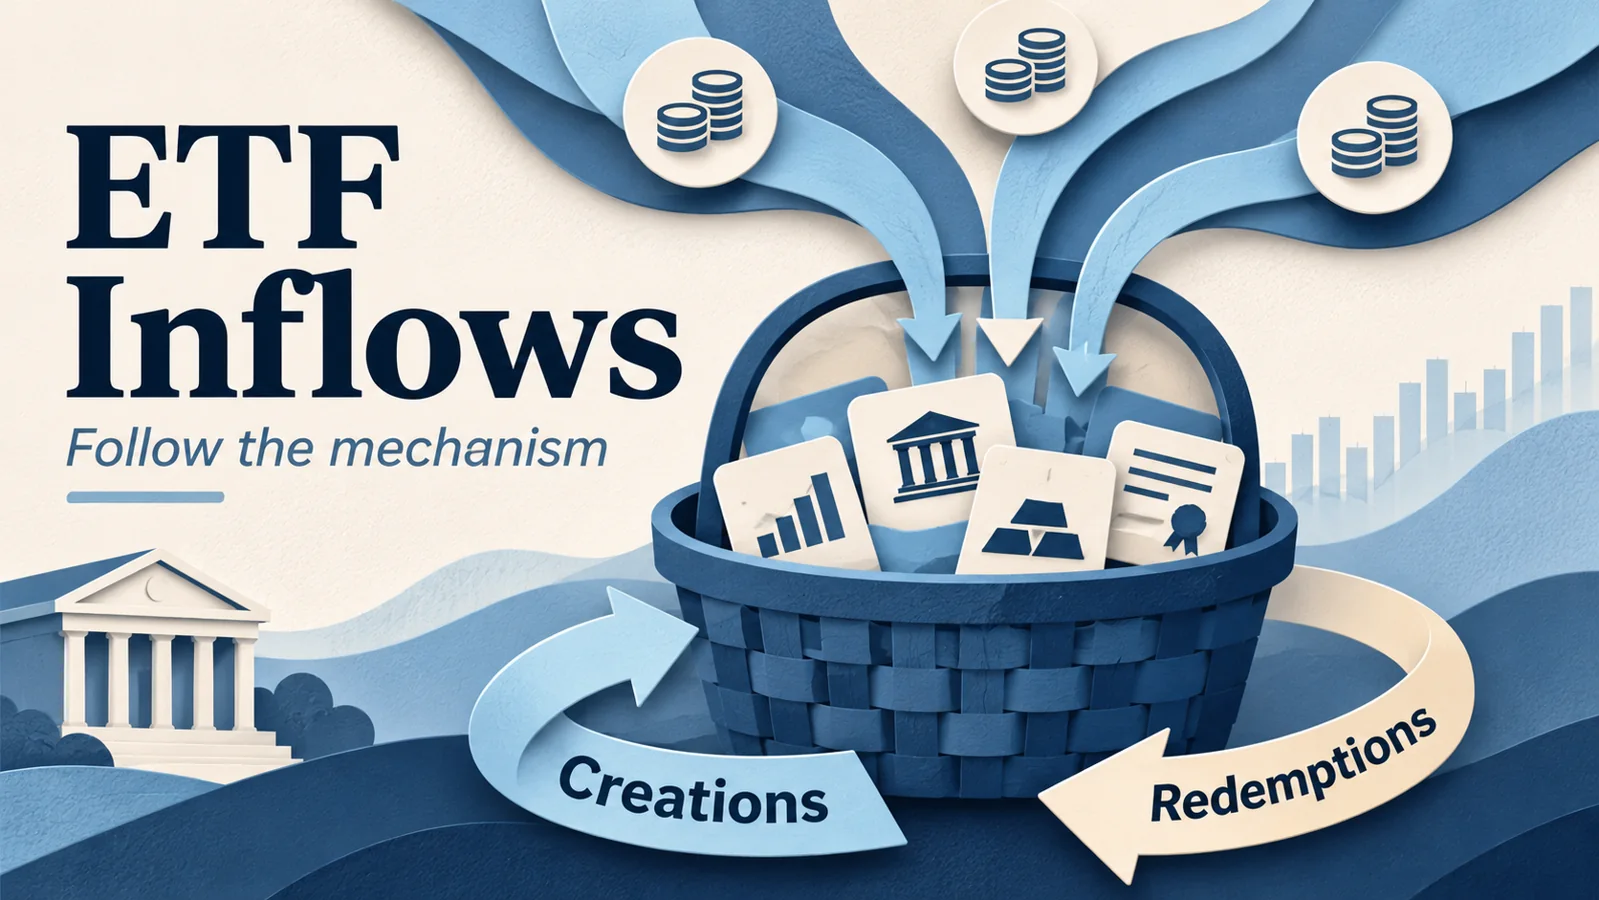
ETF inflows describe net additions through an exchange-traded fund’s share creation and redemption mechanism. They are useful evidence about demand for an investment vehicle, but they are not the same as trading volume, investment performance, or a prediction that its holdings will rise.
On November 22, 2026, ETF analyst Eric Balchunas discussed flows reversing after an event-driven trade. The general lesson is valuable even without relying on a particular fund or daily dollar figure: money can enter a vehicle for reasons that have little to do with a long-term buy-and-hold thesis.
Before following a popular flow chart, separate three questions. Did the fund issue additional shares? Did its underlying investments gain value? And does the exposure suit your own portfolio? This guide explains how to answer those questions with a worked example and a practical research checklist.
What is an ETF inflow?
Most individual investors trade ETF shares with other market participants on an exchange. When you buy shares from another investor, ownership changes hands, but that trade alone does not require the fund to issue any additional shares.
Creation and redemption happen in a separate primary-market process involving authorized participants. In broad terms, these institutions deliver a specified basket of securities, cash, or a combination to receive a large block of ETF shares. Redemption reverses the process. The Investment Company Institute’s ETF structure guide explains this distinction and why retail trading and direct fund transactions are different activities.
Net creations represent inflows; net redemptions represent outflows. Products vary in their permitted baskets and procedures, so confirm the structure in the relevant documents. A conventional stock ETF, a commodity trust and a derivatives-based product should not be treated as interchangeable simply because each trades under a ticker.
| Activity | What changes? | What it tells you |
|---|---|---|
| Investor trades ETF shares | The owner of existing shares | Secondary-market activity |
| Net ETF share creation | Shares outstanding increase | Primary-market inflow |
| Underlying holdings rise | Portfolio value increases | Investment performance |
ETF inflows versus trading volume and assets under management
Trading volume counts shares exchanged over a period. The same share can be traded repeatedly, so high volume does not mean an equivalent amount of fresh capital entered the portfolio. An active market can help investors transact, but volume is a separate measurement from net creations.
Assets under management, usually shortened to AUM, measure portfolio size. AUM can grow because the holdings appreciate, because investors add capital, or both. It can fall despite inflows if the underlying investments lose sufficient value. The headline “assets increased” is therefore incomplete without a bridge explaining the change.
Consider a hypothetical ETF starting with $100 million. Its existing assets earn 5%, adding $5 million, while net creations contribute another $3 million. Ending assets are approximately $108 million in this simplified example. Calling the entire $8 million increase an inflow would overstate new capital by $5 million.
Real calculations need to account for the timing of flows, distributions, expenses and methodology. Nevertheless, this simple bridge is a useful check: opening assets, plus investment results, plus net flows, adjusted for other changes, should explain closing assets.
A large dollar inflow needs a denominator
Suppose two funds each receive $50 million. For a fund beginning with $500 million, that equals 10% of starting assets. For a $50 billion fund, it equals 0.1%. The dollar headline is identical, but the relative scale is very different.
Calculate both the absolute flow and its percentage of beginning assets before comparing funds. Then compare equivalent time windows. One day’s spike can disappear within a week, while a smaller but persistent pattern may deserve more investigation.
Next, ask whether the apparent winner is part of a wider rotation. Investors may move between similar funds to change fees, execution arrangements or portfolio implementation. One issuer’s gain and another’s loss do not necessarily imply that investors increased their overall exposure to the asset class.
These are alternative explanations to investigate, not claims about the motives behind every trade. Public flow data generally show activity more clearly than intention. Without additional evidence, a chart cannot identify the beneficial owner or prove why a creation occurred.
Why inflows are not a guaranteed bullish signal
It is tempting to reason that money entering a fund must drive its price upward. But an ETF’s market price, its net asset value, its creation mechanism and the market for its underlying assets interact. Flows alone do not establish the direction or size of a future price move.
The SEC’s ETF investor bulletin explains premiums and discounts, trading costs and the importance of reading fund documents. A creation may help meet demand for ETF shares without creating a persistent premium. Paying more than the portfolio value is a separate risk from choosing the portfolio itself.
Flow reports can also be published after trading has already occurred. Reacting to yesterday’s capital movement may mean paying today’s price for information other participants have already considered. Always distinguish a useful description of activity from a tested trading strategy.
A six-step checklist for reading an ETF flow report
- Identify the instrument. Confirm its legal structure, strategy, holdings and benchmark before interpreting the ticker.
- Check the measurement. Determine whether the chart shows net flows, gross creations, trading volume or AUM changes.
- Match dates. Record the observation period and publication time. Compare like with like.
- Scale the result. Calculate flows as a percentage of beginning assets and compare several periods.
- Look across peers. Investigate whether activity represents a move into the asset class or between similar vehicles.
- Return to the portfolio. Evaluate costs, concentration and the exposure you would actually own.
For a personal research notebook, create columns for ticker, strategy, starting AUM, net flow, flow percentage and explanation to verify. Add a final column called “What would this change in my plan?” If the answer is nothing, the chart may be informative without being actionable.
This approach also reduces headline bias. A visually dramatic arrow can represent a small percentage of a huge fund. A less dramatic chart can conceal a large change in a small product. Numbers become more useful when the presentation is consistent.
Questions investors also ask about ETF inflows
What are ETF outflows?
Outflows represent net redemptions over the measured period. They do not mean that every remaining investor sold or that the fund must fail. Compare the size, persistence and product context before drawing conclusions about its prospects.
Can an ETF price fall while it receives inflows?
Yes. In a hypothetical example, a $100 million portfolio could lose $10 million through investment performance while receiving $2 million of net new assets. Ending AUM would be approximately $92 million, ignoring other changes. Flows and returns measure different things.
Does a “7% rule” tell you which ETF to buy?
A percentage mentioned in a search result is not an ETF selection standard. Ask what the number measures: a return assumption, withdrawal rate, allocation or loss threshold. None substitutes for understanding the fund’s exposure, costs and the assumptions behind the figure.
Which ETF is best to buy right now?
There is no universal answer, and the largest recent inflow does not settle it. Start with the portfolio role you need, compare similar exposures, and review the issuer’s documents. A fund can attract substantial assets while remaining unsuitable for your objectives.
Research reviewed November 22, 2026. Examples are hypothetical and simplified. This article provides financial education, not personalized investment advice or a recommendation to trade a particular fund.


